IGNITE
IGNITE
a platform that analyzes and visualizes urban mobility data. Created in collaboration with the government of Tallinn, Estonia.
—
Type: EIT Digital Certificate Summer School Project - Integrating Personalised Mobility Solutions for Digital Cities. Digital Cities - Urban Planning.
Role: Co-Entrepreneur - UX Researcher - Prototype Designer
Timeline: 2 weeks.
Skills: Business Development, Teamwork, Time Management, Disruptive Design, Design Thinking, Storytelling, Paper Prototyping, Thematic Analysis, Rapid Prototyping, Project Management.
Tools: AdobeXD
Team: Michael Michailidis, Priscilla Nini Ikhena, Abdul Aziz Alkathiri Ba ́lint Kova ́cs, and Niels Dikken.
Project Report: EIT Digital Summer School - Ignite.
—
BACKGROUND
I had the opportunity to spend two lovely weeks this summer (2019) in the beautiful city of Tallinn, for a summer school certificate program at TalTech University.
The theme of this summer school was focused on mobility as a service, traffic safety using open data, on-demand driving solutions, as well as exploring mobility analytics. We were challenged during these two weeks to identify problems in these sectors and brainstorm on solutions.
We did research and found out that by 2050, the global urban population will increase by 75% to 6.3 billions, which will therefore increase the number of passenger traffic by 51%. Nowadays, in the EU, 72% of passengers’ kilo- metres are covered by cars, and decreasing this number will have positive outcomes and impact in several segments in Europe and the rest of the World (e.g pollution, economy, congestion).
PROBLEM
We all know having less traffic would be ideal, however this task is not simple, as it mainly requires accurate and properly analysed traffic data and trends of an enormous amount of people. This is the main challenge of governments as they already have access to a huge amount of data related to their citizens but they do not know how to use them properly.
Urban developers generally have access to big amounts of mobility data, but it still lacks in some aspects. They can display the traffic patterns based on mobile connections to cellphone towers, but this approach does not provide high enough precision to determine which mode of transport is used. In addition, no demographic parameters are attached to it, which would help in creating solutions specifically targeted for a given area. The procurement of such data with accuracy is no easy feat. While some existing solutions have mapped out mobility patterns of people with somewhat reasonable accuracy, the lack of context, such as demographics and mode of transport, limits the full potential use of such data.
Likewise, the private sector, such as real estate developers, often face the problem of determining the suitable locations for the projects, as location is the key factor.
Solution
To solve this problem, we created Ignite, a tool that is able to integrate different data sources, and visualize this data.
The results and data sets used can also be exported in order for users to leverage them in other modeling tools for city planning. This way, we save users the time and money of conducting a traditional analysis. This is combined with a very attractive and scalable pricing.
For this project, I mainly focused on understanding our principal user persona by speaking with the Chief Transit Officer of Tallinn, to understand the city’s needs and gaps they needed to be filled.
That helped us tailor our MVP to creating a prototype that displayed all of this data in a relevant manner, targeting relevant scenarios - understanding how people move in the city, their modes of transportation, and demographic data on who these people are.
PROTOTYPE
The prototype served as our MVP for the pitches we made, covering these core scenarios:
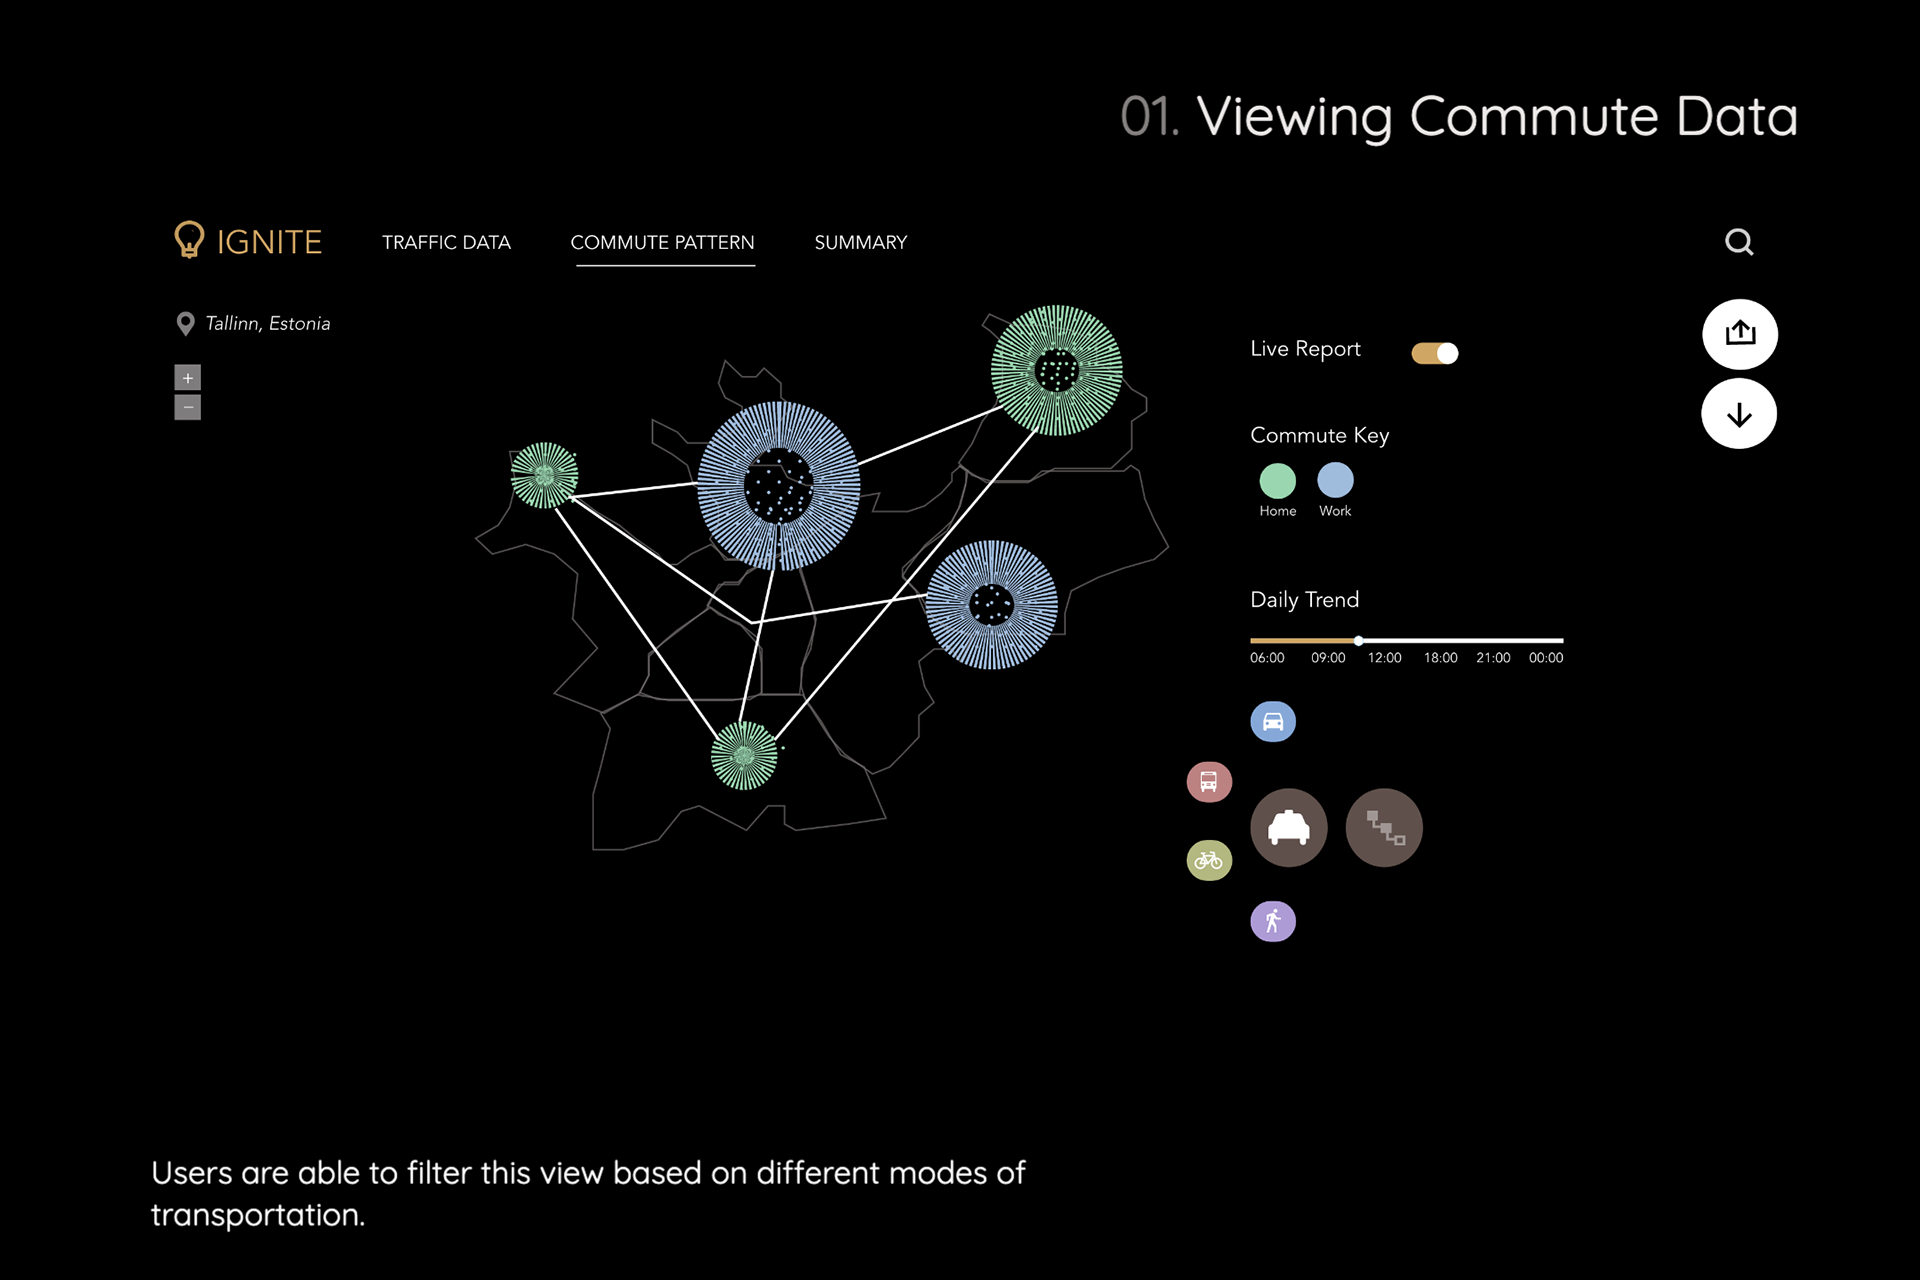
Viewing Commute Data.
Viewing Demographic Data.
Viewing a Heat Map of the City.
Exporting and Importing Data.
FUTURE WORK
For our MVP, we focused more meeting the government of Tallinn’s needs. However, for future work, we plan on incorporating scenarios around real-estate developers who may need this data for constructing new buildings, and retail stores who may need this data for marketing purposes amongst many other reasons.
Please read more about our project and business model, here: